


What is ‘Apex CPU Time Limit Exceeded?’
If you’ve ever encountered the error message, “Apex CPU time limit exceeded,” you’ve run into Salesforce’s timeout limit for transactions based on CPU usage. The message indicates your transaction is taking too long and, therefore, has been shut down. And unfortunately, it was shut down with all completed and in-process tasks reverted.
These error messages affect data accuracy, timeliness and, eventually, speed to lead. They’re also a signal you likely have bigger root problems in your Salesforce org.
What is causing the CPU time limit error?
Salesforce imposes a CPU usage governor limit for every given execution context, from 10 seconds for synchronous transactions to 60 seconds for asynchronous transactions.
Just as they sound, in a synchronous transaction, all actions are done at one time. In an asynchronous transaction, actions are done in multiple transactions.
Simply, the combination of your Apex code and any declarative tools, including AppExchange packages, must not exceed those systemic limits.

CPU timeouts primarily occur in two very different situations.
First, in a relatively simple process, you attempt to process too many records at once, resulting in your code hitting the processing limit. The second situation involves processing a smaller number of records through a process too complex for Salesforce to handle within its CPU time limits.
All that being written, your CPU time is a simple function of the number of records multiplied by the time to process.
CPU time = (# of records) x (time needed to process)
There are a few exceptions to these primary causes of CPU timeouts. One, your inserts, updates or deletions may meet conditions that trigger something to happen after the fact. Two, you may have long running or poorly written Apex classes.
Whose Job is it to Fix a CPU Timeout Error?
For many RevOps or SalesOps pros, a CPU timeout error is often passed to a technical team. However, it’s helpful to identify patterns and be prepared to answer questions like:
- Does this normally occur when a batch is running? Or is this from an action from within the Salesforce interface / layout?
- Does this happen during a large operation?
- Were there any recent changes to the Salesforce instance? Any new applications or updated applications?
- Was a new Salesforce Flow or Process Builder launched?
It’s also important for Ops pros to evaluate the business impact of the time out. What is the urgency? If the error is urgent, Ops pros need be prepared with workarounds.
Conducting a Salesforce CPU audit
You should conduct periodic Salesforce CPU audits even if you’re not currently experiencing timeout errors. It’s always a good practice to discover what consumes the majority of your CPU time, and a good audit is absolutely necessary if you’re looking to scale.
Use the following steps to conduct your own CPU audit. Be sure you’ve first enabled the live Debug Log:
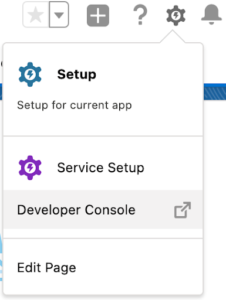
1 – Access the Developer Console
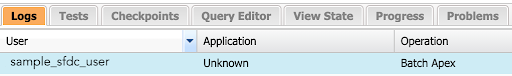
2 – Select a log from the “Logs” tab
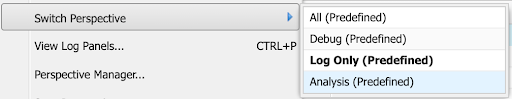
3 – In the Debug menu on the top navigation bar, select Switch Perspective and then Analysis (Predefined)
4 – Select Timeline, then choose your relevant Scale
Given the resulting timeline view, you will be able to see the execution sequence for your Apex, Workflow and Database actions, and how much time each consumes. With that data, you can then dive deeper into the details of what actions are consuming too much of your CPU time.
The best place to start is to investigate the creation of leads, contacts and accounts, determining how long the system takes to run Apex code, validation rules, workflow rules, process builders and database queries.
How to solve Apex CPU time limit errors
If you’re hitting Apex CPU time limit exceeded errors, the quick, relatively easy fix includes:
- process your manual inserts in smaller batches
- schedule your automation to run only when and where needed
- control your batch size in automated updates
For more complex processes, there are a variety of possible root causes and corresponding solutions, and an overview of each is provided below.
Process Builder
The Process Builder most often causes CPU timeout errors when there are multiple processes per Object. Best practice is to consolidate multiple processes into only one process per Salesforce Object. One possible solution is to migrate your automation from Process Builder to an Apex trigger, as triggers often work faster and are less prone to produce an error. However, Apex triggers are more difficult to build, and often require developers who have experience with complex coding.
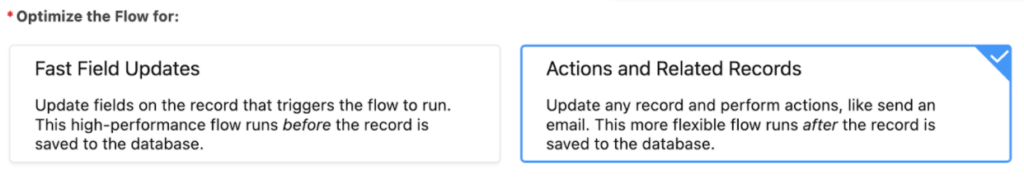
Flows
Flows often cause CPU timeout errors when they happen after save rather than with the before save flow feature from SFDC’s Spring 2020 release. Migrate your existing flows to the new model and select the before save option upon the creation of your flow.
There are many situations where Apex code causes CPU timeout errors, including the following:
- Inefficient filters when looping or diving into nested layers of a loop can lead to higher processing costs. The loops and layers are not the real issue, but an unfiltered/poorly-filtered list of records adds unnecessary operations to records, as an excess of data might be getting pushed further into nested loops. Every nested loop that doesn’t first filter the data enough is going to add another operation to excess data. So, poor filtering in nested loops could lead to exponentially higher CPU demands.
- Multiple triggers require more processing; limit the number of triggers fired on one update.
- Circular updates between two objects result in a continuous, never-ending execution loop and, eventually, a CPU timeout. Rewrite to eliminate the loop.
- Querying and updating the same object multiple times wastes resources; implement a practice of one update on one object.
- Updates that call the same update trigger more than once within a transaction are unnecessary. Eliminate multiple calls in a transaction.

Lastly, managed packages from the AppExchange can be disproportionately consuming your resources. While AppExchange packages receive an increase for a lot of different Salesforce limits, CPU time is not one of them.
A managed package shares the same CPU pool with everything else in your Salesforce organization. You cannot edit the code of most managed packages, so it’s critical to only keep packages in your instance that add value and uninstall those that are no longer needed.
Optimize your Salesforce instance to avoid APEX CPU Time Limit Errors
LeanData recognizes your business relies on Salesforce. When your Salesforce org slows down, it affects your ability to go to market and likely increases your time to revenue.
Salesforce is a shared resource, with multiple customers, applications and ISV (Independent Software Vendor) partners all running on top of it. Everyone and everything competes for scarce resources, and Salesforce has systems to deal them out in allocation.
The challenge for any Salesforce customer looking into performance issues is that Salesforce does not provide the visibility, tools and diagnostics for you to easily understand what’s happening. And, that’s critical. We all need to understand and address the root causes of problems, not symptoms.
As mentioned above, a great place to start to understand root causes of slow performance is an audit using a debug log. While it takes a technical understanding of Salesforce, it does shed light into what’s taking up your scarce SFDC resources. Watch out for your own customizations. Salesforce does not protect you from yourself!
Within LeanData’s role as a Salesforce ISV partner, we take seriously our responsibility to act as a discerning steward to the entire Salesforce ecosystem. We write our app’s triggers to be lightweight, and asynchronous processing is utilized to ensure that LeanData has minimal impact to your record update CPU load.
Also, within the LeanData lead-to-account Matching and Routing products, specific user tools allow you, the customer, to prioritize the handling of different objects and lead types. This ensures your hottest leads, like a demo request, are fast tracked, while lower priority leads, like trade show booth visitors, are processed later. The end result is a judicious and prudent use of Salesforce resources.
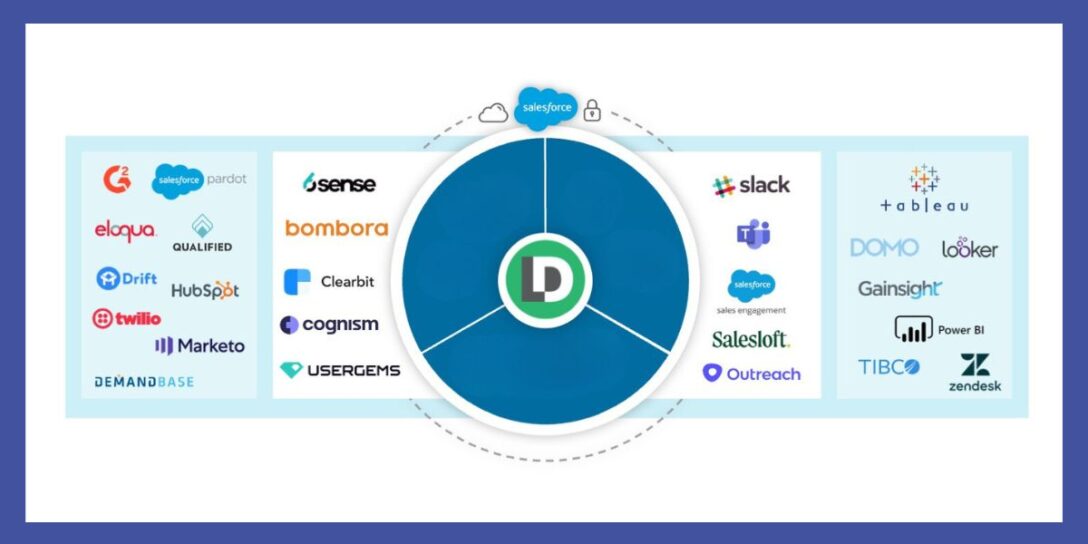
LeanData sits at the center of your revenue tech stack, capturing signals, calling plays, and helping technologies work together seamlessly.
When it comes to Salesforce, we are all in this together. While Salesforce is the preeminent CRM, it does present its occasional challenges, and CPU time limit exceeded errors are the biggest thorns.
Use the tips above to eliminate those obstacles and get your go-to-market motions back on track!