Blog 
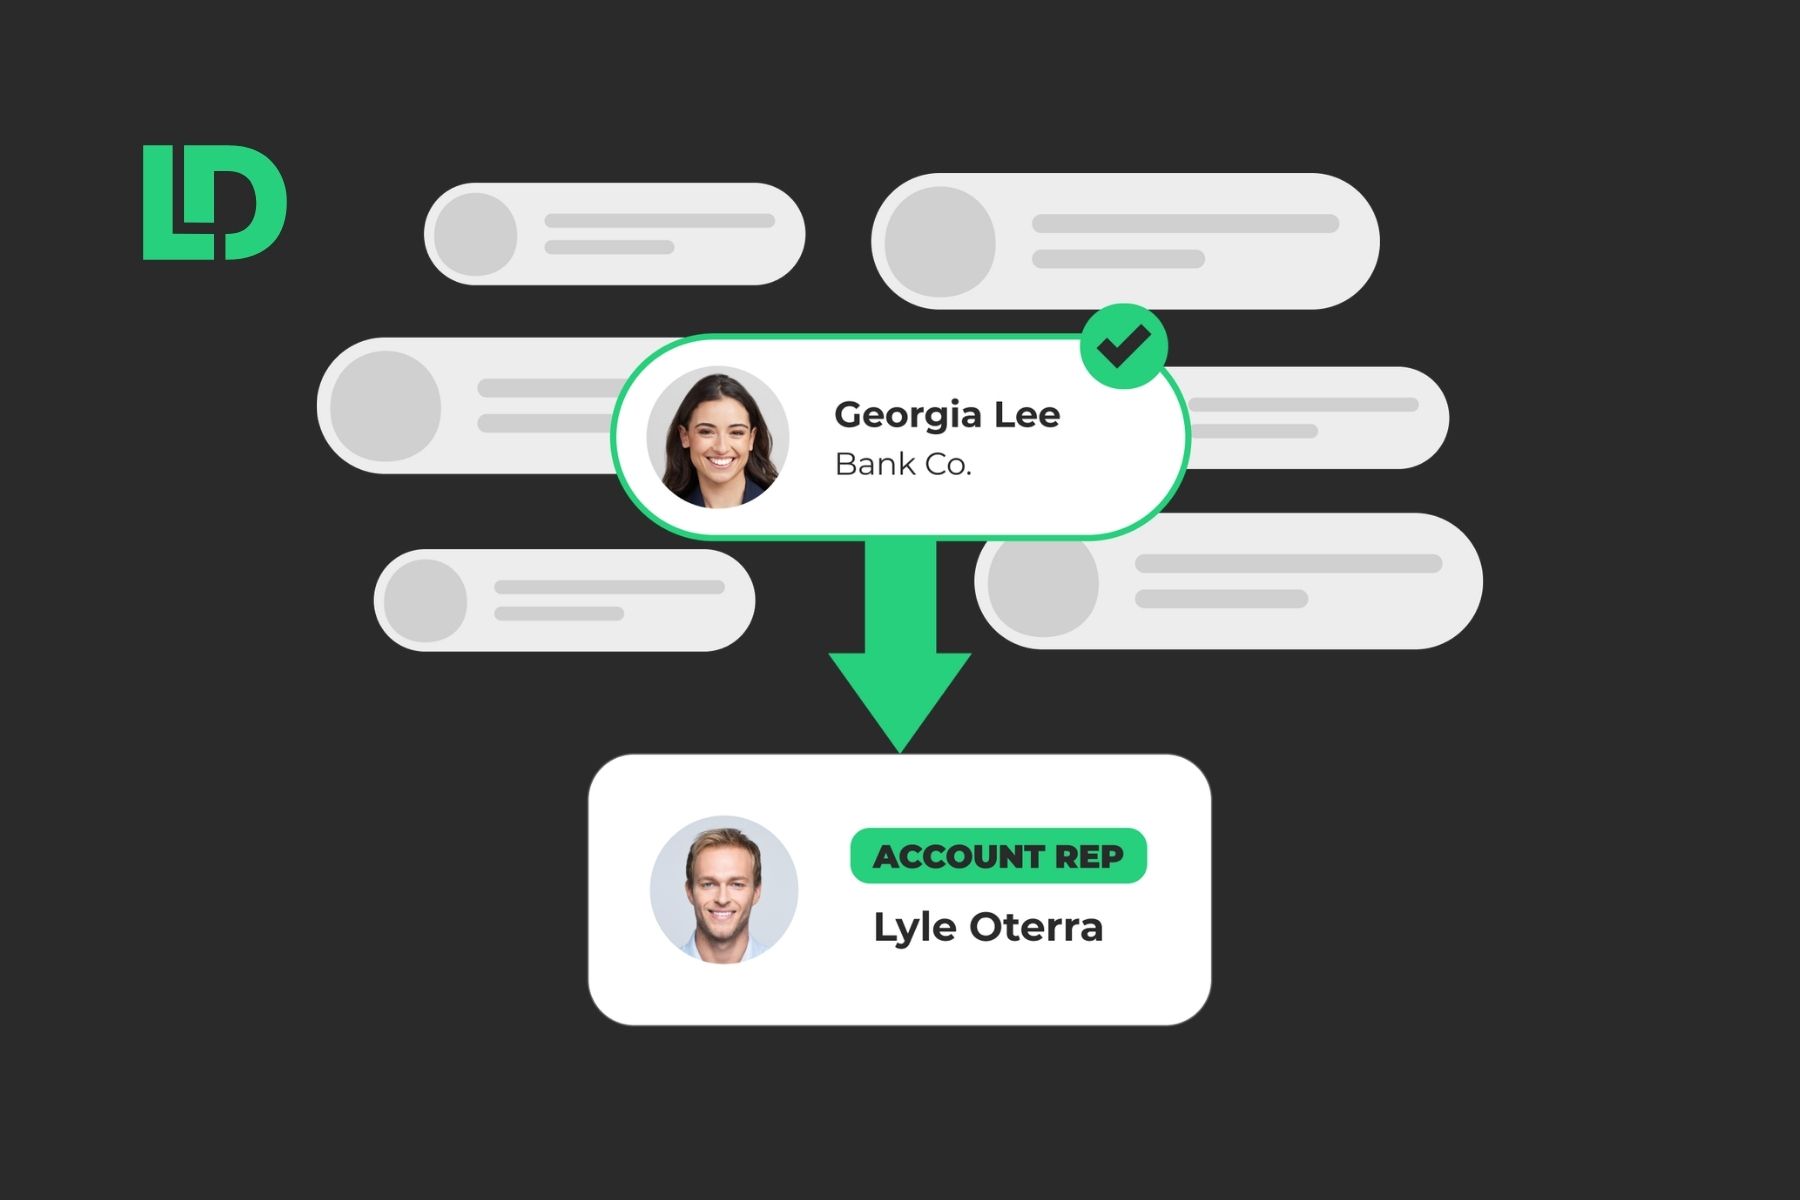
How to Align Sales & Marketing on Lead Handoffs: A Practitioner’s Guide
Most sales and marketing teams blame culture for broken lead handoffs, when the real problem is a process nobody ever built. Learn how to fix the lead handoff.
Blog
LeanData AI GTM Customer Survey: What 157 B2B Revenue Leaders Reveal About Scaling AI
See what 157 B2B revenue teams revealed about scaling AI, and why AI GTM orchestration keeps agents coordinated, governed, and trusted.
Blog
How to Build an AI-Ready Sales Tech Stack
Most sales tech stacks have the right tools and now, the right AI agents. What they're missing is the foundation that makes tools and agents work together.
Blog
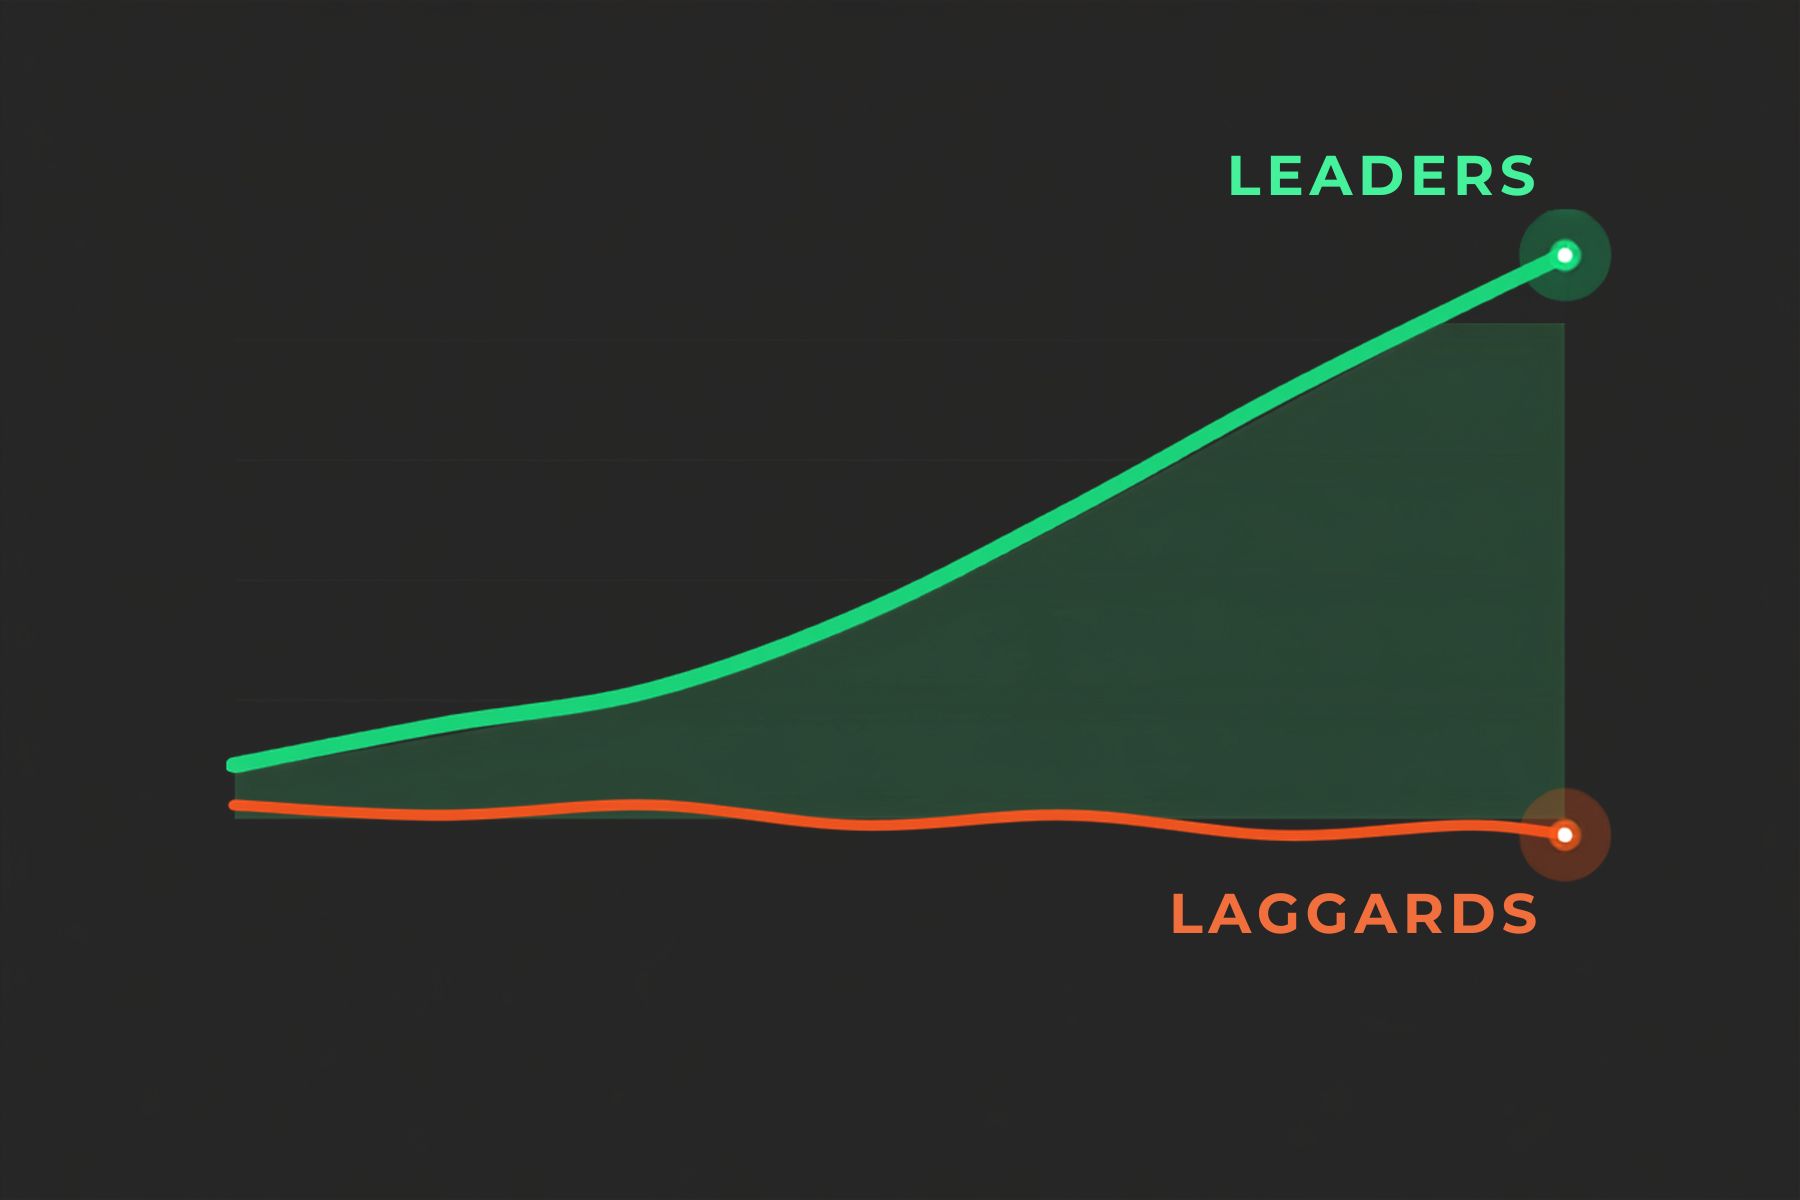
What Separates GTM Leaders from Laggards: It’s Not What You Think
The gap between go-to-market leaders and laggards has almost nothing to do with how much they spend, and everything to do with three habits most teams overlook.
Blog 
The 2026 B2B State of Martech and Revenue Operations Report: Insights for Go-to-Market Leaders
Enterprise teams are pouring money into AI while the routing, data, and governance that make it pay off fall further behind. Learn what revenue leaders should fix first.
Blog 
AI SDRs at Enterprise Scale: What They Do, Where They Break, and How to Make Them Work
AI SDRs are already in 93 percent of GTM teams. Here's what you need to know before you scale one.