


Sales and Marketing teams are continuously pressed to grow revenue. However, building a strong and healthy sales pipeline is usually the key first step in that process. After all, a revenue team can’t close opportunities if those opportunities don’t exist in the first place.
As a result, a leading indicator of the eventual success of all revenue teams is sales pipeline performance. Unfortunately, there’s not a lot of data to help sales and marketing leaders judge the effectiveness of their own sales pipeline management.
In July and August, LeanData, along with Atrium, Clearbit, Modern Sales Pros and RevOps Squared, surveyed sales and marketing leaders to benchmark inbound and outbound sales pipeline performance. The survey also tracked associated metrics used to measure and report upon pipeline performance. The findings shed light on the fact that many sales and marketing leaders are performing in the dark!
Download your copy of the 2022 Inbound & Outbound Sales Pipeline Performance Benchmarking Report.
Data discipline missing from many sales pipelines
The 2022 Pipeline Performance Benchmarking Survey uncovered data on a wide variety of topics:
- Pipeline performance metrics
- Pipeline sources by organization
- Pipeline sources by channel
- Lead conversation rates by source
- Cost per Lead
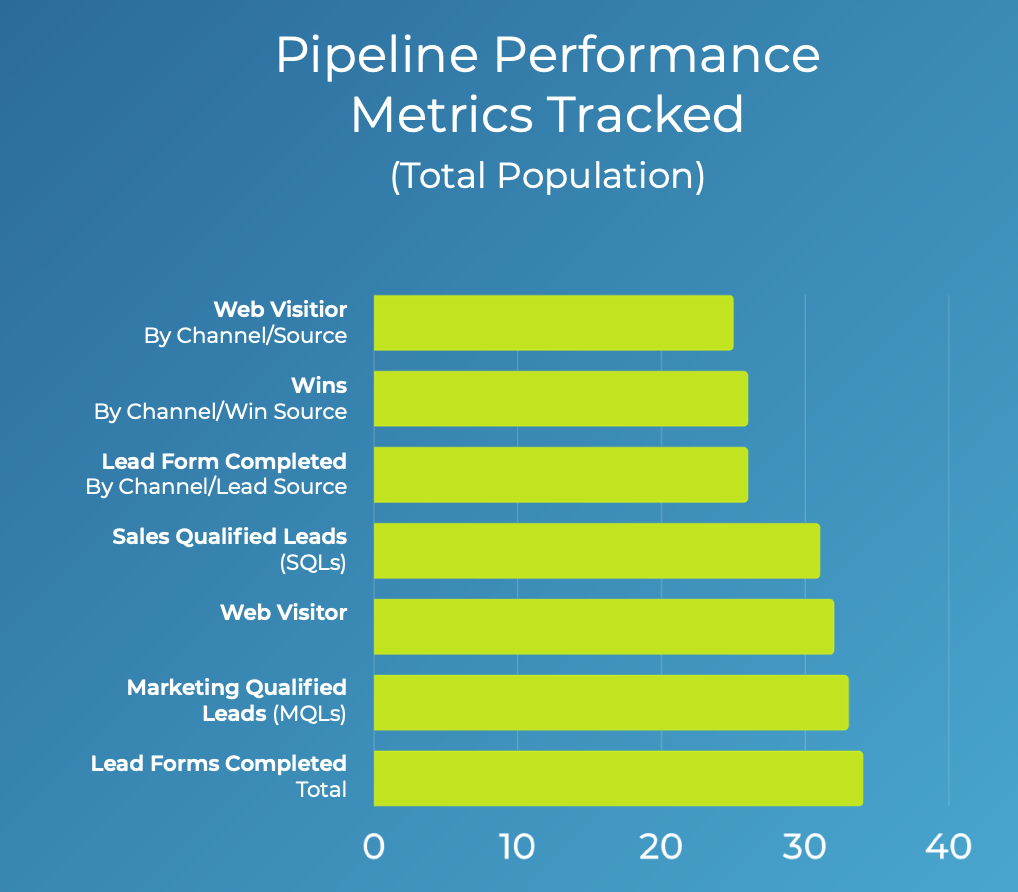
For most companies lack the most foundational sales pipeline performance measurements. Lead Forms Completed is the number one pipeline performance metric tracked at 34% of companies. However, only 26% of companies measure Win Rate by Channel or Source.
From there, the survey data suggests it gets worse. Only 19% of companies measure Cost Per Dollar of Revenue. Further, just 13% measure Cost Per Dollar of Pipeline. Not only are revenue team leaders generally uninformed on the best channels and tactics for growth, they’re uninformed on the cost of growth.
Unfortunately, when it comes to investing budget and personnel, many Sales and Marketing leaders lean into decisions based on instinct rather than data.
Isolated metrics pose potential to mislead
Isolated performance metrics threaten to potentially mislead revenue team leaders.
Thirty-two percent of companies measure Cost Per Lead (CPL). However, as mentioned above, only 19% measure Cost Per Dollar of Revenue and just 13% measure Cost Per Dollar of Pipeline. Used in isolation and outside of a revenue-generating context, CPL becomes somewhat of a “vanity metric.”
Cost Per Lead can be directional and adds some value period-over-period. But, without a revenue context, leaders don’t know the best sources and channels in which to invest to meet sales pipeline and revenue goals.
Sales pipeline data tends to be fragmented
The 2022 Inbound & Outbound Sales Pipeline Performance Benchmarking Report shows most companies don’t track the metrics needed to optimize revenue performance. Orchestrating and aligning the pipeline lifecycle from the initial point of engagement through to Closed/Won has traditionally been viewed as a best practice for high-growth companies.
Tracking conversion rates all the way to Closed/Won is the ultimate way to highlight and prove pipeline development ROI on an organizational and channel level.
The study’s findings suggest the root cause lies in fragmented sales pipeline data. At best, data is not readily accessible and/or distributed with transparency. At worst, it’s not being collected.
When auditing your organization against peer benchmarks, ensure you’re first collecting data from your customers’ buying journeys. Be cautious of inaccessible data as it is frequently a symptom of a disconnected RevTech stack.
For the complete finding of the Pipeline Performance Benchmarking Survey, download your copy of the 2022 Inbound & Outbound Sales Pipeline Performance Benchmarking Report today.