- Platform
- Customers
- Partners
Featured PartnersLearn About Our Partners

LeanData’s integration with Salesloft allows a user to route prospects to the right reps.

Slack has transformed business communication– it’s the platform where work can happen.

Expertly target and engage high-value accounts when they’re ready to buy.

LeanData’s integration with Outreach allows a user to route prospects to the right reps.
- Resources
Learning Support
- Company


Resource Center
All the authoritative go-to-market content you need to maximize the effectiveness and efficiency of your revenue teams

eBook
- June 25, 2025
Winning the Lead Management Distribution Game
Discover how to turn lead distribution into a competitive advantage by replacing outdated processes with smarter, faster, systems that boost conversion and increase pipeline.
Learn more
Webinar
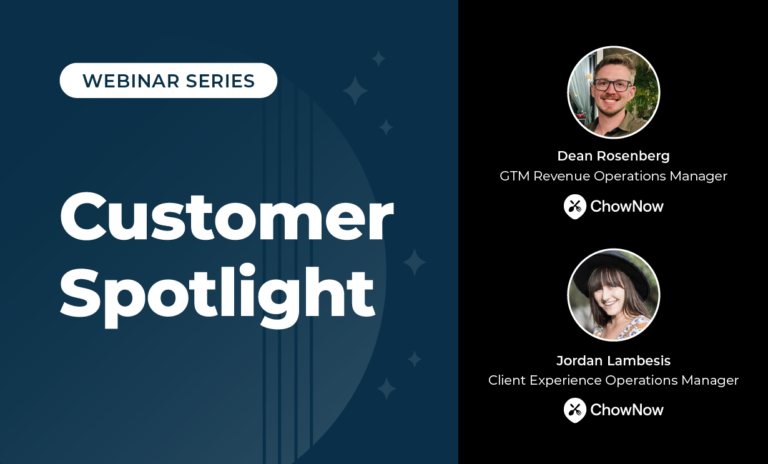
LeanData Customer Spotlight: ChowNow
Get an inside look at how ChowNow uses LeanData to accelerate every step of the customer journey – from rapid lead response to efficient customer onboarding.
Video
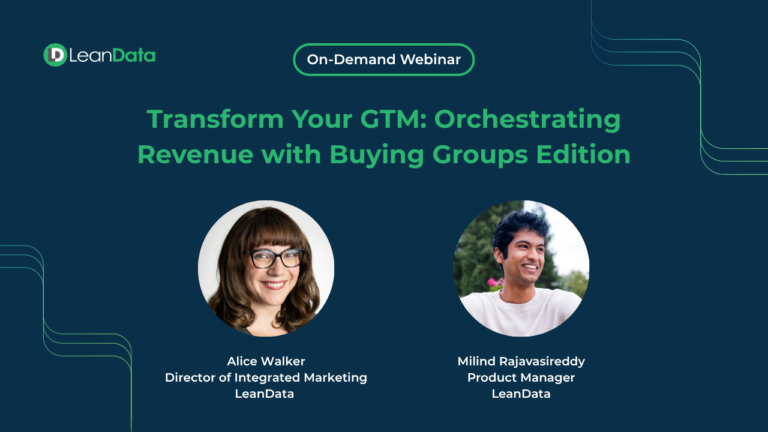
Transform Your GTM: Orchestrating Revenue with Buying Groups Edition
Discover how Buying Groups Edition gives full visibility into enterprise deals, improves CRM accuracy, and drives multi-threaded pipeline growth.
Video
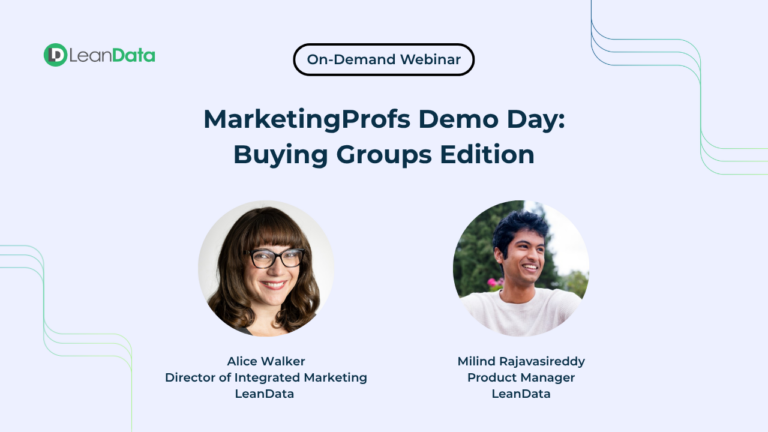
Marketing Profs Demo Day:Buying groups Edition demo with Leandata
In this session, we showed how LeanData Buying Groups Edition tapped into Salesforce to give Sales, Marketing, and RevOps full visibility into the actual people driving enterprise decisions.
eBook
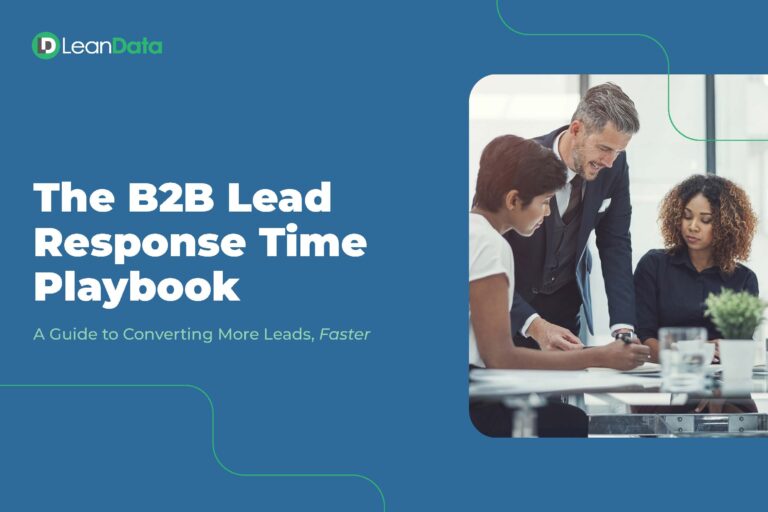
The B2B Lead Response Time Playbook
Every minute you wait to respond to a lead slashes your chances of winning the deal. This playbook shows you how to fix it fast.
eBook
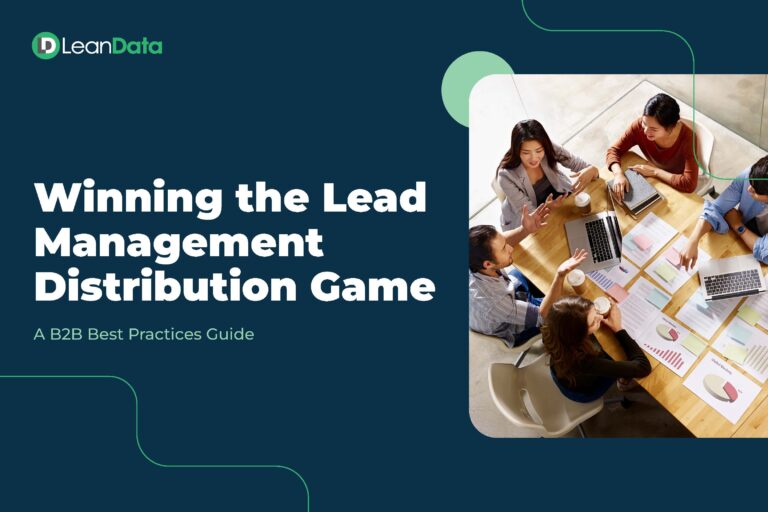
Winning the Lead Management Distribution Game
Discover how to turn lead distribution into a competitive advantage by replacing outdated processes with smarter, faster, systems that boost conversion and increase pipeline.
Solution Brief
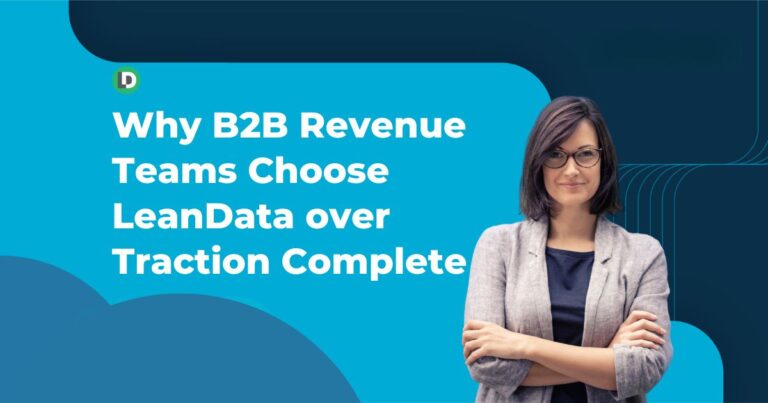
Why B2B Revenue Teams Choose LeanData Over Traction Complete
Want faster lead response, cleaner data, and clearer insights? See why revenue teams consistently choose LeanData over Traction Complete.
Webinar

Rethinking the MQL: The Rise of Buying Group Strategy in ABM
Are MQLs still relevant in modern ABM? LeanData CEO Evan Liang joins industry experts from Palo Alto Networks and TechTarget to debate buying group strategies and revenue processes that drive B2B success.
Infographic
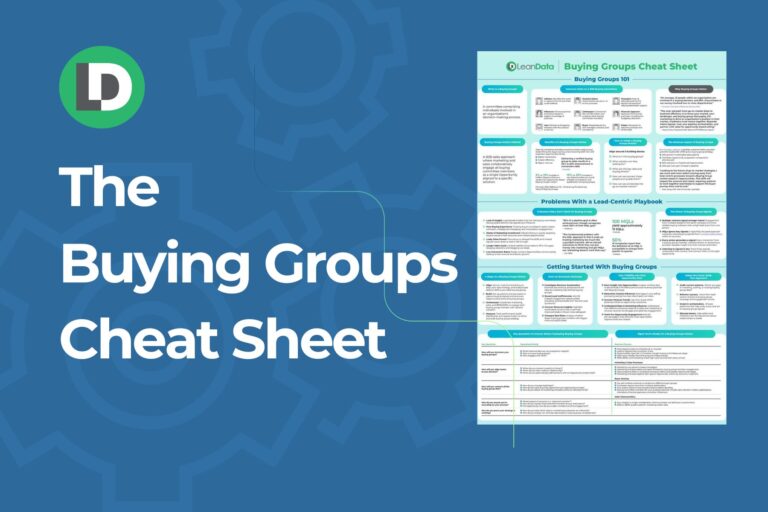
Buying Groups Cheat Sheet
Tired of lead-based chaos? Grab the Buying Groups Cheat Sheet and see how real revenue power comes from engaging the entire buying committee.
Solution Brief
Why More Revenue Teams Are Breaking Up with Chili Piper
Ditch the duct tape and tap into a go-to-market execution engine that actually works. See why LeanData is the smarter choice.
Video
Driving Revenue with Buying Groups: LeanData Demo Day
Watch this RevGenius Demo Day session to see how LeanData’s Buying Groups Edition helps revenue teams engage full buying committees and drive more accurate pipeline inside Salesforce. Senior Solutions Consultant Rob Deutsche walks through a 7-step Buying Group Journey to show how top GTM teams turn signals into smarter, faster deal cycles.
eBook
The Enterprise Guide to Choosing Lead Management Software
Don't let a bad system block your best leads. Read the guide and find the solution that fits your team, your tech stack, and your goals.
Webinar
From MQLs to ABM to Buying Groups: The Evolution of B2B GTM Strategy
Learn how to evolve your B2B go-to-market strategy by shifting from MQLs to ABM and Buying Groups. Featuring insights from LeanData, Forrester, and Demandbase.