

When lead routing evolves quickly, the structure behind it doesn’t always keep pace.
As priorities shift, business rules change, and new stakeholders come on board, your LeanData routing graph can grow in ways that make it harder to manage.
The good news? You don’t need to rebuild everything to restore clarity.
With a few smart strategies, you can simplify your existing graph, reduce maintenance effort, and build a system that’s easier to scale and share across teams.
Whether you’re a LeanData admin today or evaluating how it could support your operations, this guide walks through practical ways to clean up your graph and keep it organized for the long haul.
Start With a Cleanup: Remove What You Don’t Need
Over time, it’s easy for a graph to accumulate outdated branches, temporary fixes, and logic that’s no longer relevant. If you inherited a LeanData setup from a previous admin, this might be your current reality.
First, look at Routing Insights and Deployment History to find branches that haven’t processed records recently. If a section of your graph hasn’t had activity in weeks or months, it might be a candidate for removal.
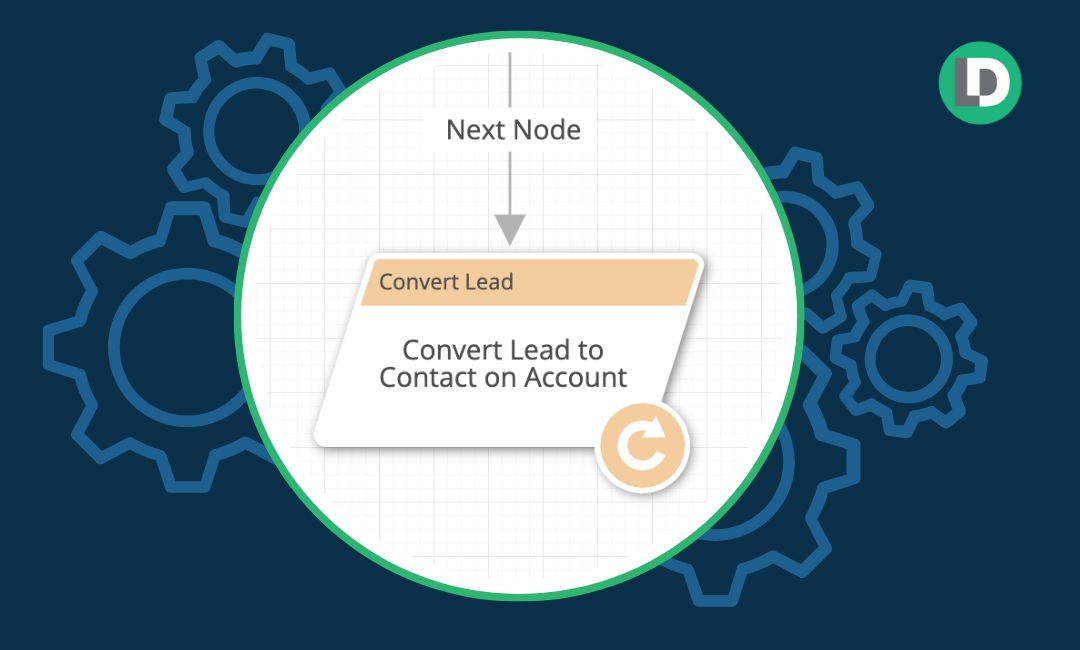
Next, create update nodes to stamp records that pass through suspect branches so you can track usage before making a change.
Then, use comments directly on the nodes to note which pieces you’re reviewing or planning to delete. If you’re not ready to delete something, add a temporary stop node instead. This lets you pause the logic and safely test outcomes without losing any configuration.
Plus, some admins recommend keeping a running comment or a URL link to a changelog doc to track edits over time.
That’s a smart habit if more than one person is updating your environment.

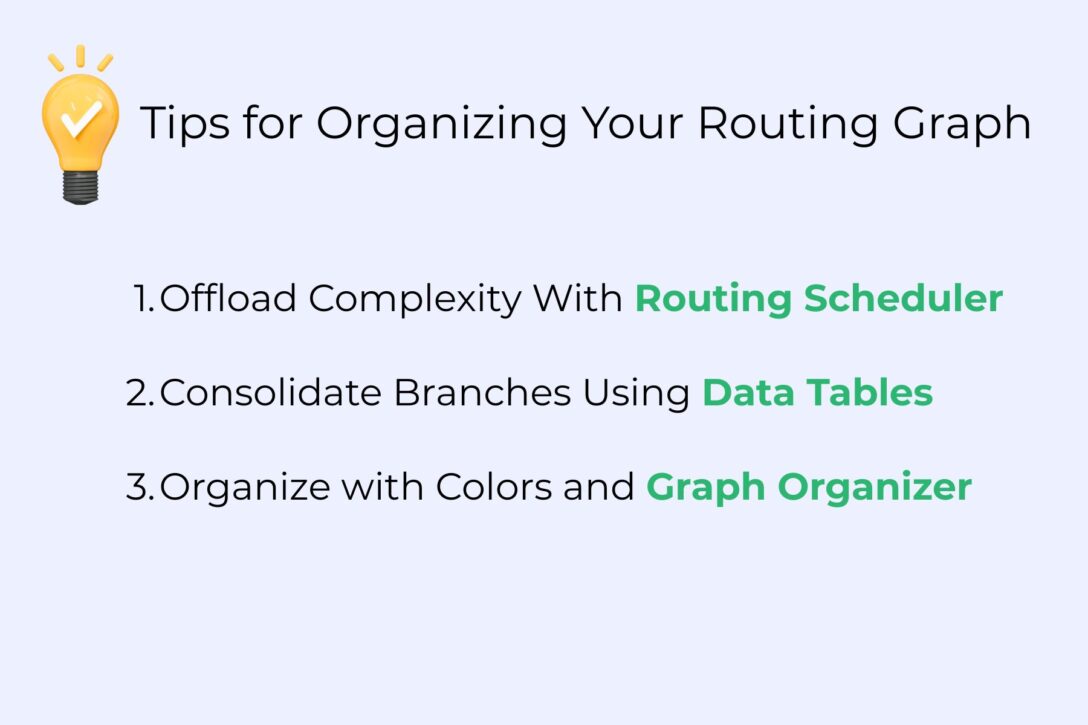
Use Data Tables to Consolidate & Simplify Logic
If your graph contains large decision branches that check many criteria, like country, zip code, partner status, or custom field values, this is where data tables can help.
Data Tables Best Practices
- Instead of building out long conditional branches with multiple lines and update nodes, you can store all that logic in a single, manageable table. One node can then reference that table, reducing clutter and visual noise.
- Data tables work especially well when you have to evaluate a high volume of variable values, such as matching domain names to account owners or routing leads by regional territory. Just remember to keep your tables documented and review them regularly to ensure mappings stay current.
Many LeanData users report faster troubleshooting and fewer routing errors when they shift complex logic into tables.
Consolidating logic this way eliminates redundant branches and helps new admins understand the process more quickly.

Offload Logic with Routing Scheduler
Sometimes, a branch needs to stay in your routing process, but it doesn’t need to run immediately. That’s where the Routing Scheduler comes in.
Instead of keeping rarely-used branches in your main graph, move them to a scheduled graph that runs on a defined timeline. You can set scheduled jobs to run as often as hourly or break them into multiple graphs depending on the function.
For example, if you have a lead enrichment process that only applies to webinar attendees or partner records, consider running that logic nightly instead of in real time. This keeps your main routing graph lighter and easier to maintain.
As a result, you’ll see clearer visual flow, better organization, and fewer maintenance headaches. You can also use business unit stamps to direct records to the appropriate graph automatically. It’s yet another small change with a big impact.
Color Code & Group for Better Navigation
Even a clean graph can feel overwhelming when it’s large. LeanData’s Graph Organizer helps you visually structure your setup by assigning colors to related sections.
Use a consistent color system to indicate:
- Teams
- Regions
- Routing stages
Collapse those nodes to reduce on-screen clutter and make your workspace easier to navigate. This approach helps you:
- Quickly find and focus on specific sections of the graph
- Assign graph maintenance responsibilities to different admins or business units more easily
Plus, when nodes are collapsed, LeanData automatically streamlines the connecting lines, keeping the visual experience tidy without changing any functionality.
Document Decisions and Collaborate Like a Pro
Documentation isn’t only for compliance. It’s what turns a chaotic graph into a scalable system.
Start by using the comment and description fields inside nodes to explain what a node does, why it exists, and when it was last changed.
Then, take things a step further.
Some admins document changes externally using ticketing tools like Jira, including the ticket number in the node description to create traceability. Others keep a shared doc with timestamps, logic decisions, and links to sandbox test cases.
Using Variables to Avoid Duplicating Logic
One way to avoid duplicating logic is to use variables. These make your graph more efficient and reduce the risk of human error when updates are needed.
You can even use enrichment nodes as alternative entry points, which helps spread out your logic and reduce congestion at the start of your graph.
Last, make use of simple tricks like spacing things out, aligning branches vertically or horizontally, and using special characters in node names to quickly identify them.
Some LeanData admins use an asterisk to mark admin-only nodes. This helps new teammates avoid making accidental changes.

Make It Easier for the Next Admin (Or Future You)
You may know every inch of your current graph today, but what about next quarter? Or the next person who steps into your role?
Simplifying and future-proofing your graph means designing for maintainability. Here are some best practices for graph building and maintenance:
- Use consistent naming conventions, clear color schemes, and labeled sections.
- Comment your changes and store historical context where others can find it.
- Create fallback nodes when testing.
- Use visual and organizational cues to communicate intent.
These habits not only reduce mistakes, they make it easier for your team to adapt as routing needs change. They also shorten the learning curve for anyone jumping in to troubleshoot or optimize your setup. Routing graphs evolve. Building in structure now prevents cleanup later.
And remember, small adjustments lead to big long-term gains in visibility, performance, and sanity.

Kim Peterson
Kim Peterson is the Senior Manager of Content Strategy at LeanData where she digs deep into all aspects of go-to-market strategy and execution. Kim's writing experiences span tech companies, stunt blogging, education, and the real estate industry. Connect with Kim on LinkedIn.