


Ops pros know the power of getting things right behind the scenes.
It’s about the clean handoffs, timely follow-ups, and streamlined processes that contribute to business growth.
LeanData plays a critical role in making that happen. But, once orchestration is running smoothly, the next question becomes: how do you measure that success?
This guide covers the metrics and methods Ops teams across Sales, Marketing, and Revenue use to track the impact of LeanData.
From routing performance to conversion rates, you’ll see how data can drive better decisions, smarter staffing, and faster sales cycles.
1. Save Time and Prove It: Cost Savings Through Automation
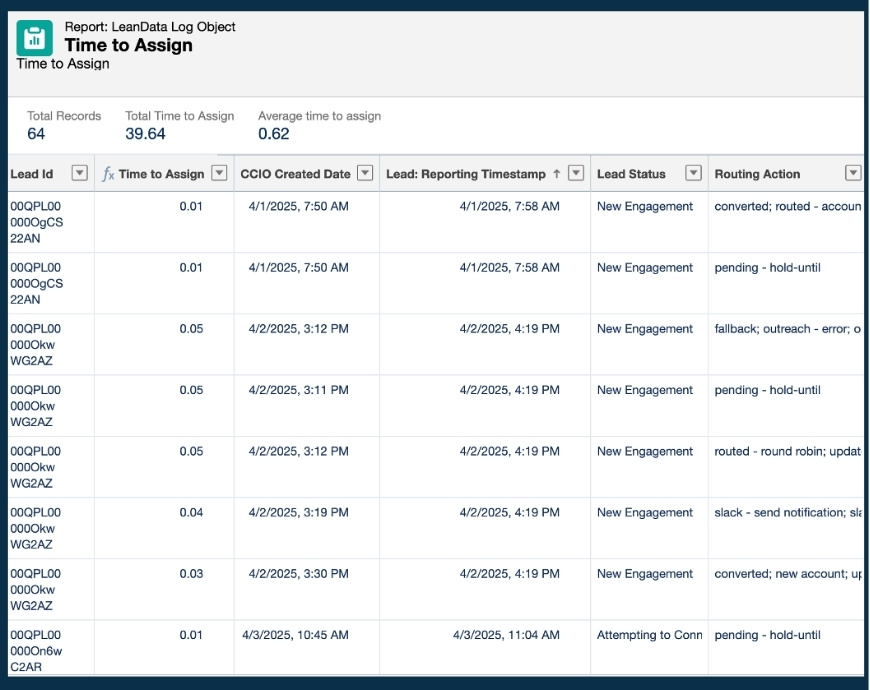
Time is one of the most valuable resources in Ops.
Before automating lead routing, teams often spend hours matching leads to accounts, reassigning misrouted records, or responding to complaints about missed follow-up.
With LeanData, you can reduce or eliminate these delays. Plus, ops teams can use LeanData reporting metrics to quantify how much time and money they save with automation.
Key metrics to track:
- Time from lead creation to successful assignment
- Time spent troubleshooting or rerouting leads
- Account match rate
- Manual hours saved
Tips for collecting data:
- Use a formula field to calculate time between record creation and assignment
- Track the number of matched leads and apply an average time-per-lead to estimate time savings
- Multiply by the average hourly rate to quantify cost reduction
- Reference audit logs and routing insights to validate improvements
These metrics are especially useful when justifying tool renewals or headcount requests.
2. Optimizing Headcount and Territory Planning
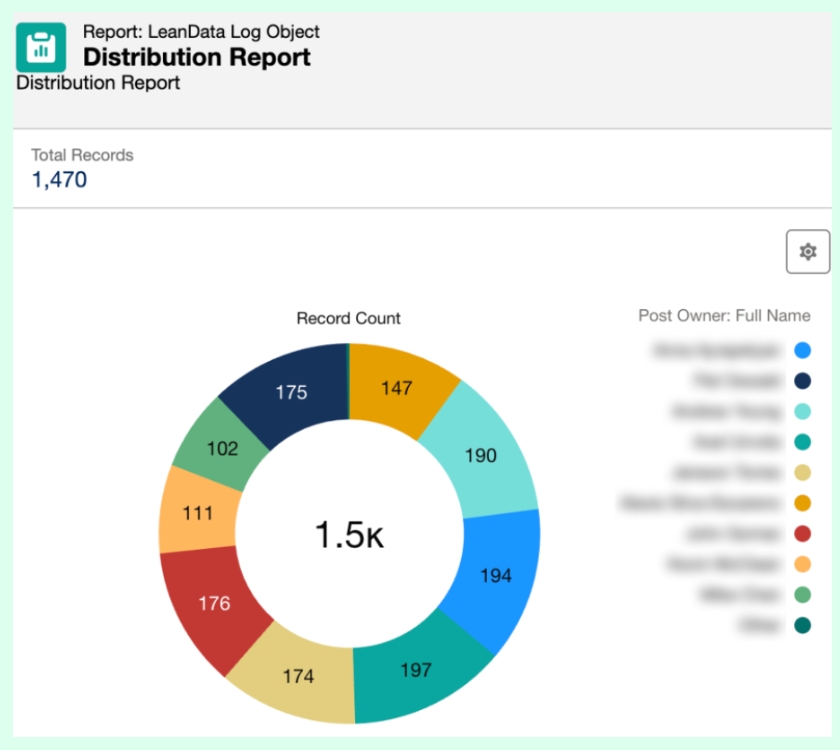
Nothing throws off productivity like an uneven workload. One rep gets 10 leads a day, another gets 100 and both miss quota.
Using LeanData reporting metrics, teams can measure distribution volume across reps and territories and identify where changes are needed.
Metrics to report:
- Number of records per rep or territory
- Average time to first action
- SLA compliance across teams or regions
How teams track it:
- Use “Hold Until” nodes and the Time to Action Tracker to measure real-time responsiveness
- Set up dashboards using the Log object to display volume by rep or team
- Implement capacity-based capping to prevent over-assignment
- Use data to restructure territories or hiring plans
This is not just about efficiency. These metrics help ensure equitable workload distribution and maximize rep productivity.
3. Driving Conversions with Faster Follow-Up
Speed wins! Or said another way, it converts.
One of the most widely adopted LeanData reporting metrics is time to first response, and for good reason: it directly impacts conversion rates.
By using “Hold Until” nodes in routing flows, teams can automatically track how long a record sits before action is taken. That data lives in the Time to Action Tracker and can be used to build SLA dashboards across reps, campaigns, or regions.
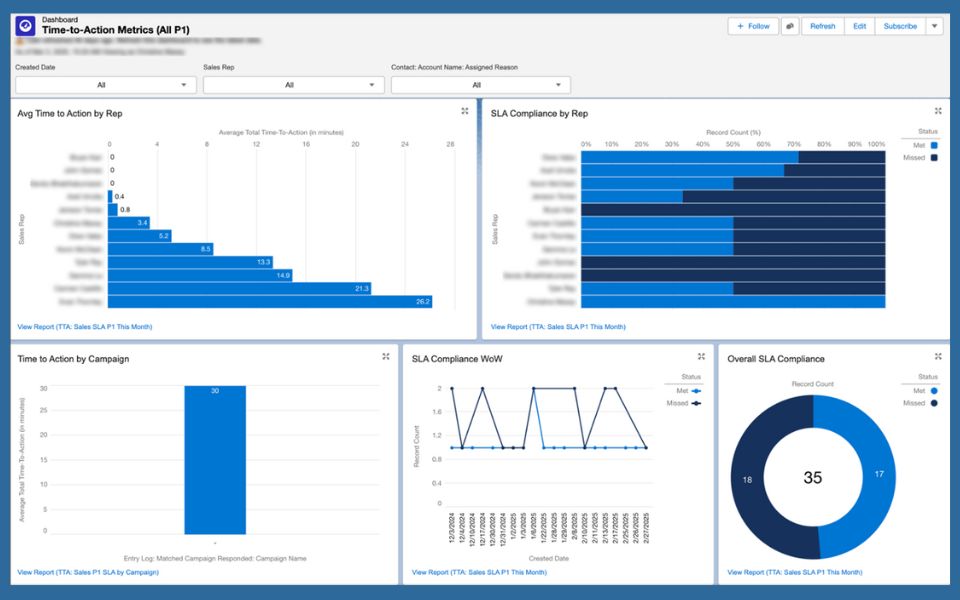
Metrics to watch:
- Time to first response
- Conversion rates based on average response time
- SLA compliance by team or region
- Stale or unengaged lead rates
Best practices for reporting:
- Use “Hold Until” nodes to measure time between lead creation and first action
- Create dashboards comparing teams or regions
- Run A/B tests to analyze the impact of SLA enforcement
- Set alerts for aging leads to prevent pipeline stagnation
Some run A/B tests to compare performance with and without SLA enforcement. Others use alerts to flag aging leads in real time. The result? Higher conversion rates and fewer lost opportunities.
4. Measuring Pipeline Velocity at the Opportunity Level
Ops teams are increasingly looking beyond lead metrics. They want to know how long deals stay in each stage and what’s causing slowdowns.
That’s why opportunity-level LeanData reporting metrics are becoming more popular.
By inserting “Hold Until” nodes at key stages, teams can track how long opportunities sit in each phase of the funnel.

Metrics to include:
- Time from lead assignment to opportunity creation
- Time spent in each opportunity stage
- Conversion rates between stages
- Win rate by stage duration
- Number of stalled opportunities
How teams set it up:
- Add “Hold Until” nodes between opportunity stages
- Build dashboards that show stage-by-stage velocity
- Use contact role assignment to connect lead engagement to opportunity progress
- Run cohort analysis to identify trends and optimization points
With this view, you can spot bottlenecks, prioritize coaching, and make informed adjustments to your sales process.
5. Evaluating GTM Strategy Through Win Rates
When it comes to win rates, ops leaders want more than a number. They want to know why some teams win more than others.
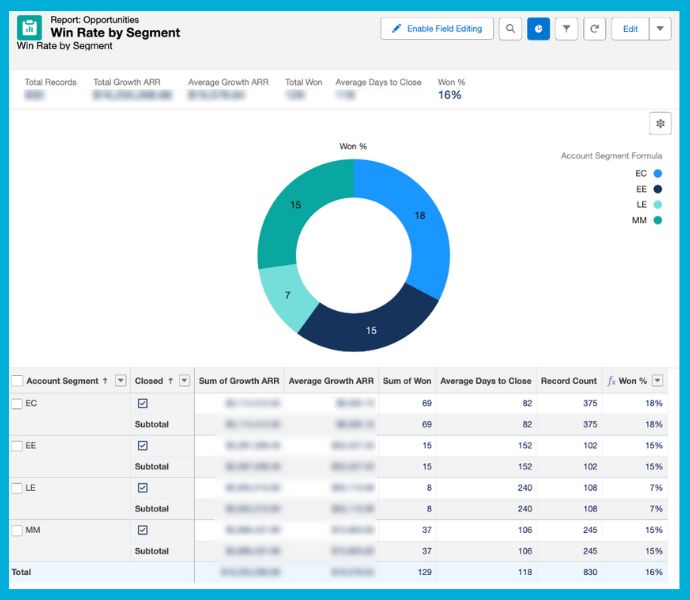
LeanData reporting metrics help teams evaluate the effectiveness of different GTM strategies.
For example, they measure win rates before and after implementing Buying Group motions or account-based routing changes.
Important metrics:
- Percentage of opportunities with Contact Roles filled
- Win rates before and after GTM strategy changes
- Number of engaged stakeholders per opportunity
Tactical ideas:
- Track Contact Role assignment and engagement per opportunity
- Create dashboards by segment or territory
- Compare pre- and post-change performance using cohort analysis
This is especially important for teams moving toward account-based marketing or complex Buying Group motions.
Bonus Tip: Use the Log Object for Custom Reporting
Many ops professionals overlook one of the most powerful tools in their tech stack: the LeanData Log object.
This Salesforce object contains all the data behind your audit logs. It tracks routing actions, assignment outcomes, and timestamps. Even better, it’s customizable.
You can map in custom fields like campaign source, territory, or routing path, then build reports using standard Salesforce tools.
Why it matters:
- The log captures routing actions, assignment details, and error data
- You can add custom fields using routing metrics mapping
- Teams use this to track ownership changes, SLA violations, and routing trends
Sample use cases:
- Group records by assigned user to analyze distribution
- Track rerouted records to identify process gaps
- Monitor SLA tracking via “Hold Until” node data
Ops teams that report on the log object gain deeper insights into what’s really happening in their systems.

Make Metrics Actionable
It’s not enough to build a dashboard. The most successful ops teams use metrics to spark change. They coach teams, justify tech investments, rebalance workloads, and adjust processes, all grounded in data.
If you’re just starting out, begin with one area: response times, assignment accuracy, or stage duration. Capture a baseline. Then test a change and measure again.
LeanData reporting metrics are most valuable when they’re used to drive improvement, not just track performance.
Want to go deeper? Start exploring:
- Time to Action Tracker reports
- Routing insights vs. audit logs
- Customizing the LeanData Log object
The tools are already there. The key is using them with intention.

Kim Peterson
Kim Peterson is the Senior Manager of Content Strategy at LeanData where she digs deep into all aspects of go-to-market strategy and execution. Kim's writing experiences span tech companies, stunt blogging, education, and the real estate industry. Connect with Kim on LinkedIn.